

Finding the next Bored Ape Yacht Club (BAYC) is hard, doing your due diligence on every crypto project before investing is complicated, and following up on every project on the web3 space is quite impossible.
However, Nansen.ai, a Blockchain analytical tool, makes financial decisions on crypto assets easy and better, which you would agree with me after reading this article.
To further understand the concept of blockchain analytical tools, you can refer to this article
Losing sight and getting drowned in the noise of the crypto-verse is a common incidence.
Blockchain analytical tools like Nansen make it possible to analyze millions of blockchain wallets, monitor their moves, and even set smart alerts on specific Smart investors, also known as Smart Money.
This is to be signalled whenever they buy or sell.
Smart Money is the term used to describe on-chain wallets (investors) who have proven to make successful investments in the past.
You can separate the signals from the noise with the help of on-chain analytical tools such as Nansen, performing due diligence on projects by paying close attention to its contracts knowing how much has been debited or withdrawn.
In the case of NFTs, this tool enables you to determine top hodlers (crypto-verse spelling of holders), how long they have held them, and whether they are accumulating or selling.
TABLE OF CONTENTS
FEATURES OF THE BLOCKCHAIN ANALYTICAL TOOL; NANSEN.AI
Nansen is a blockchain analytical tool for conducting real-time on-chain analysis, getting NFT insights, and discovering new opportunities in the crypto space.
With Nansen, you can follow Smart Money, market makers, top performers, and top crypto investors, see where funds are moving to, identify new projects or tokens, track gas usage to understand where the action is happening, and trace transactions down to the most granular level.
Investors can discover and get new insight, perform due diligence to defend their positions, play bear market defence with custom alerts and get notified when key wallets move funds.
The best data analytics in Web3 — enhanced by a powerful suite of services for professional crypto investors
Some of Nansen’s features include:
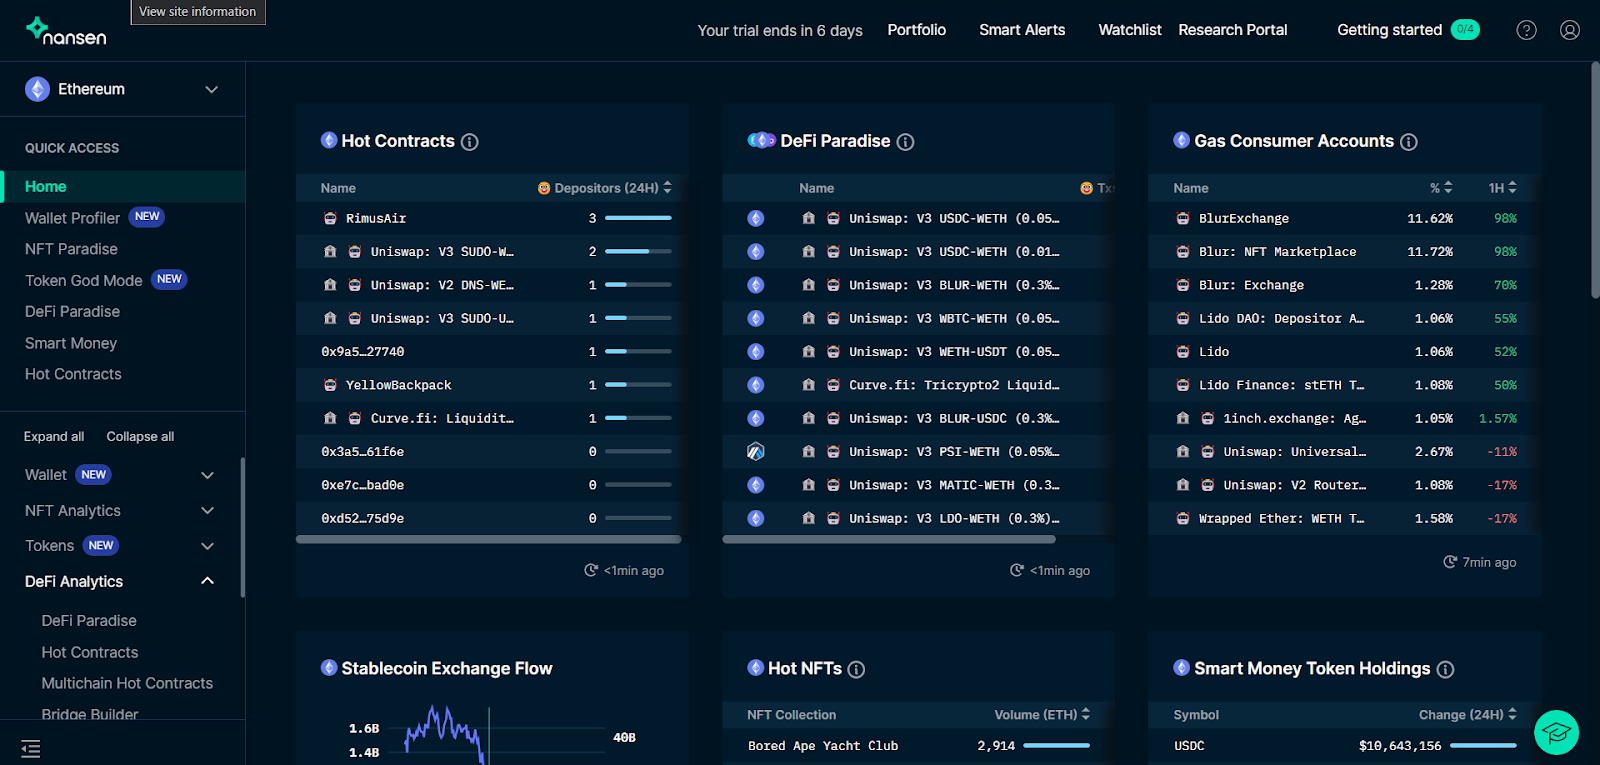
Discovery Dashboard
Nansen has a different dashboard where contracts and NFT projects can be monitored or spotted by price, transaction, volume, time trends, etc.
With categories like Hot contract, Defi Paradise NFT Paradise, Hot NFT, Hot DeFi Contracts, etc.
Wallet labels
Nansen has given names to different wallet addresses and labels according to their on-chain behaviour or history.
Certain labels and emojis have been used to categorise wallet addresses with similar characteristics.
Examples of such labels include:
- Heavy DEX trader
- Legendary NFT collector
- Smart Money(this comes as the nerd emoji)
- Smart NFT Trader
- ETH millionaire
- Active on Robin and
- Active on BSC
This will enable investors to be able to have insight into the type of wallets executing transactions or making on-chain moves.
To check out more of this, Nansen wallet labels
Real-time on-chain data
Blockchain data is revealed to investors in real time.
Smart Money
It’s a label that refers to wallet-smart investors, represented with the nerd emoji 🤓. It’s also found on the dashboard to display a list of Smart Money hodlings.
Wallet Profiler
This allows investors to input their wallet address to see any movements the wallet is making or has made.
Smart Alerts
Enables investors to create alerts for various events beyond just price alerts.
Watch list
Investors can add wallets, tokens, wallets or NFTs to your personalised watchlist.
CROSS-CHAIN ANALYTICAL TOOL NANSEN; ETHEREUM, FANTOM, POLYGON, BNB CHAIN
If you have been active in the crypto industry for a while, you would know how difficult it can be to keep up with different projects and discover alphas across different blockchains.
Nansen, which is a cross-chain and on-chain analytical tool, has made it easier to follow projects that matter to you with their dashboard bringing to you real-time on-chain data.
The dashboard was also built to enable investors to discover and spot new projects.
The whole idea is to discover new projects, analyse (conduct due diligence) and make financial moves.
The Nansen dashboard has sections such as:

Nansen sections
NFT ANALYTICS
This section enables you to analyze wallet and token addresses.
NFT Paradise
Investors can get a glance into what the NFT markets are doing in real time.
NFT God Mode
Investors can gain a macro perspective on any NFT of their choice
TOKENS
Crypto assets
Token God Mode
Investors can gain a macro perspective on any token of their choice. This helps investors to do a deep analysis of any specific token.
Exchange Flows
Token inflow and outflow on different exchanges.
Token Trends
This is new to the dashboard and still in the beta stage.
It typically displays token volumes traded, wallet interactions, and swaps, across some Dex such as Uniswap, Pancake swap, Sushi swap Ox, Balancer etc., within time stamps
DeFi Analytics
This section enables you to analyze wallet and token addresses.
DeFi Paradise
This enables investors to discover the hottest contracts cross-chain (Multichain Hot Contracts) or liquidity polls.
Hot Contracts
This enables investors to discover or spot the hottest contracts on the Ethereum network.
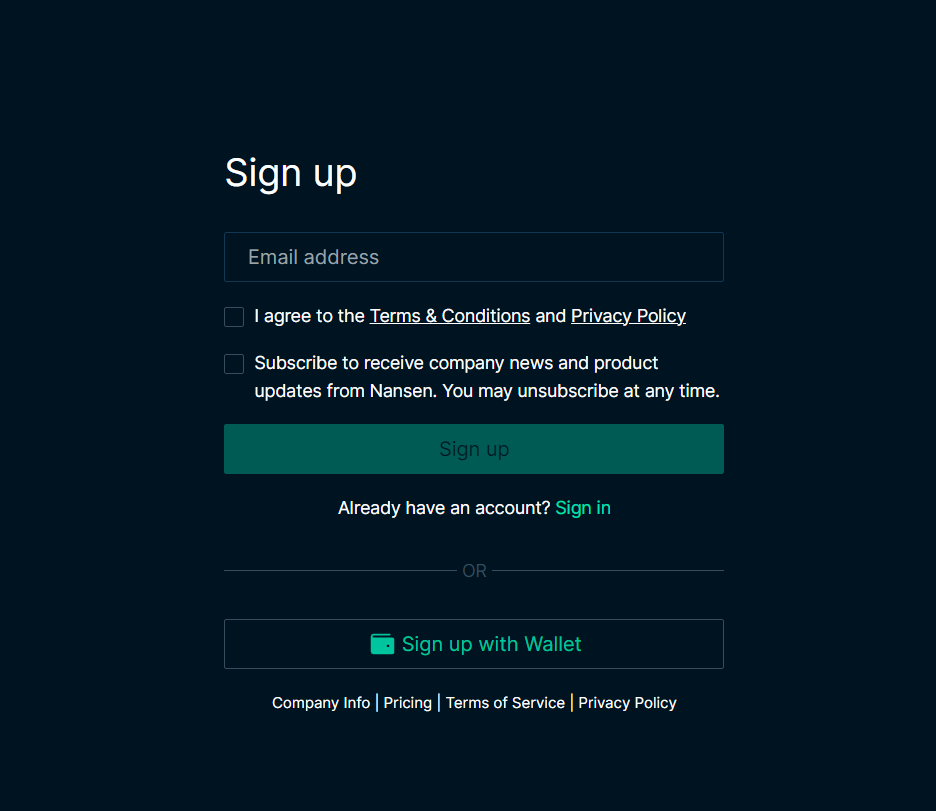
STEPS ON SETTING UP A NANSEN.AI ACCOUNT
1. Signing up for a Nansen account can be done using an email address or wallet address.
Once you are done signing up. You can sign in.
2. After you have successfully signed in, choosing a preferred subscription plan is the next thing, but Nansen is willing to let you play with some of the research tool features like DeFi Paradise, NFT paradise, Token God Mode etc. for as low as 9$ for 7 days.
This comes in handy if you are not so sure of how cool Nansen is and want to give it a try; it is a good place to start.
Payments are done with cards like Visa and master; no crypto payment yet.
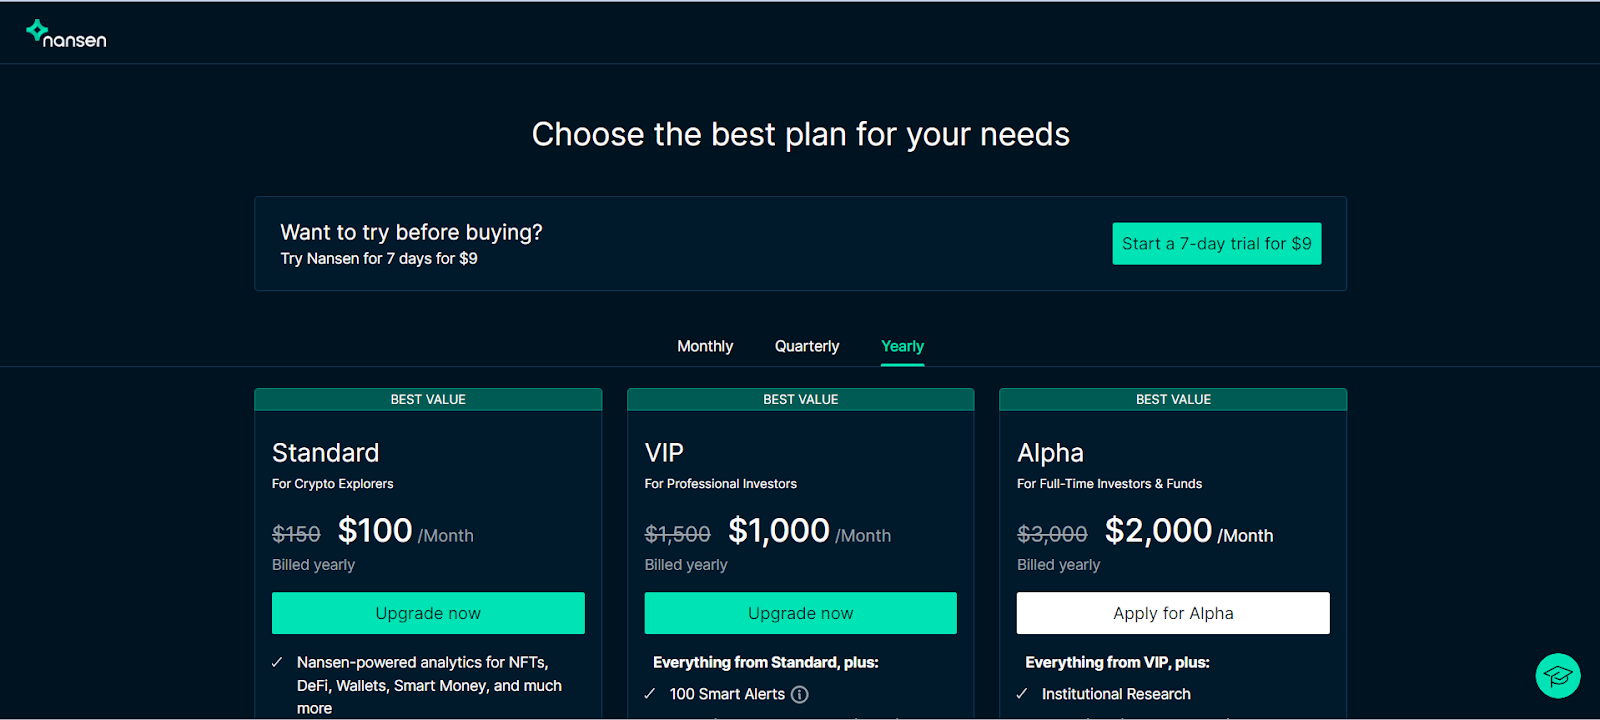
3. Once you are done choosing a plan.
You will be welcomed by a dashboard where you can analyse on-chain data according to your subscription.

Dashboard for a free trial subscription
DISCOVERY ANALYSIS AND INVESTMENT INTO NFTS USING NANSEN.AI
Aping (the act of investing without proper research on an asset) into an NFT collection can be fun but unsafe for any crypto investor.
Investing in an asset is literally made up of three steps: discovering, conducting due diligence or analysis, and then making a decision either to invest or not.
Nansen gives you an edge in analysing assets and making financial decisions, setting smart alerts to actually know when to buy or offload your bags is a feature that always comes in handy while investing or trading crypto assets.
I will be analyzing an NFT project launched in under 48 hrs., I would also compare it to something more than 1-year-old to better understand the functionality of some charts.
Some charts are better to understand when there are lots of quantities (eg, days or volume etc.).
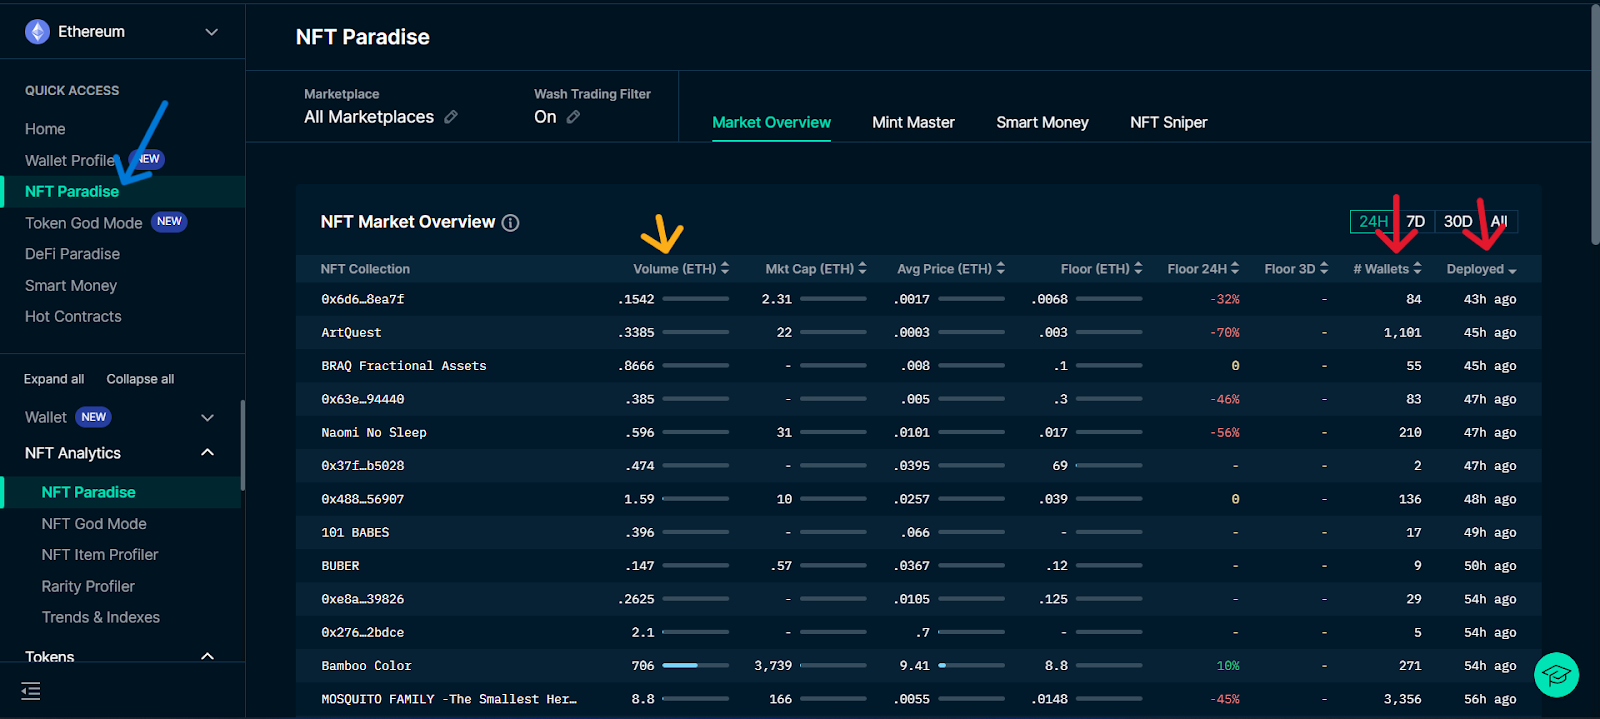
NFT paradise Dashboard; Market Overview
1. Discovering
Select NFT paradise to see NFT projects sorted by volume, market cap, price(avg and floor) or my favourites, deployed and wallets.
Volume: helps investors know the amount of ETH traded in 24hr.
Deployed: helps investors know when the smart contract or NFT was initiated; this can also help you differentiate original collections from copies.
Wallets: help investors know how many unique addresses a project has.
It might not always be the best way to sort projects, but we are good to go with a couple of other features like labelled wallet addresses.
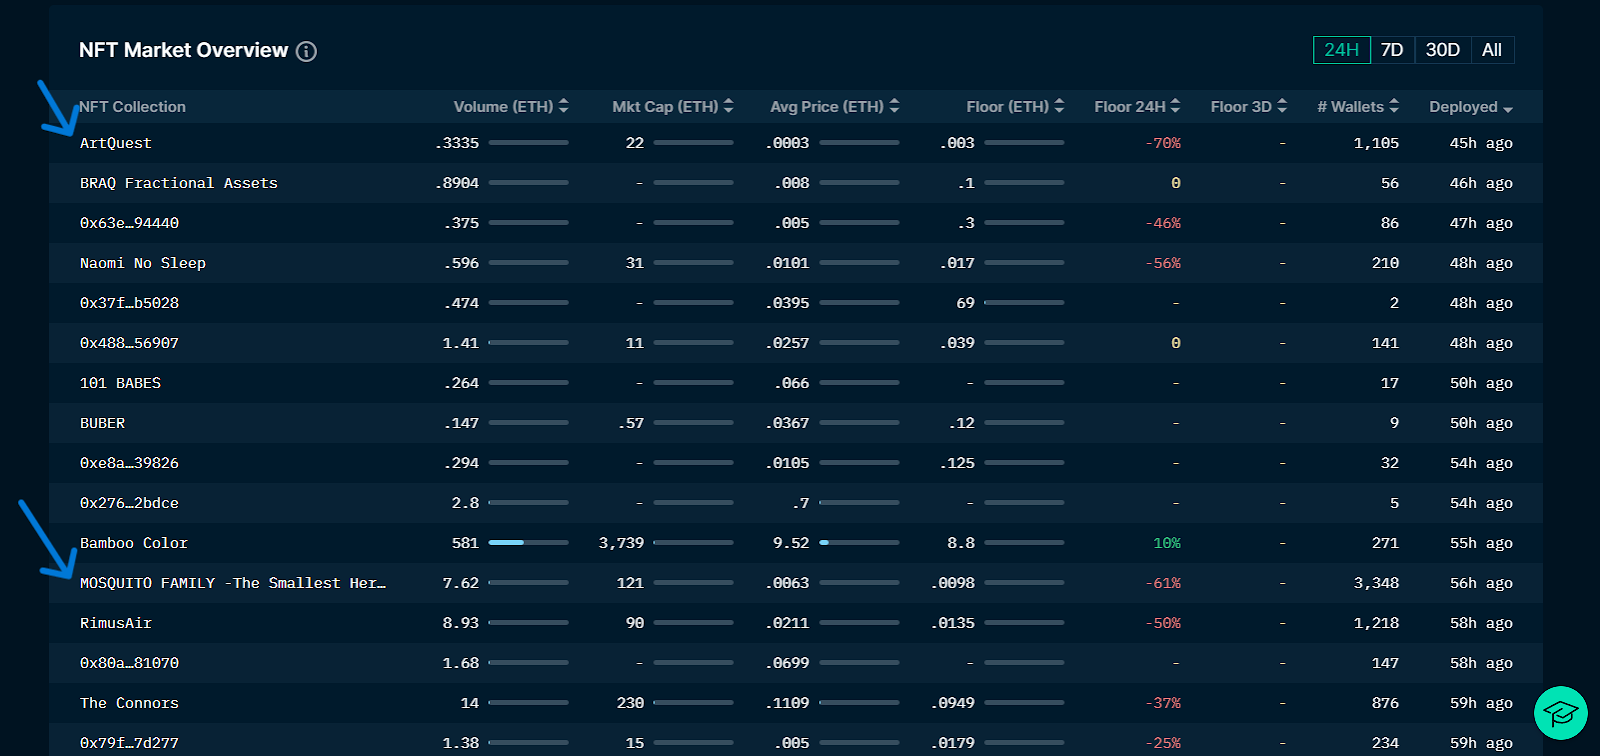
NFT paradise dashboard sorted by deployed (Descending)
From my experience, these two ArtQuest and MOSQUITO FAMILY are good enough with 1k + unique addresses, ArtQuest is less than 48 hrs, and MOSQUITO FAMILY is 48 hrs. + but with a volume of 7ETH in 24hrs.
I will stick to ArtQuest with less than 48hrs deployed time.
2. Conducting Due Diligence
Next step is to select your chosen NFT project and analyse more, which in my case is ArtQuest. This will take you to the NFT God Mode dashboard.
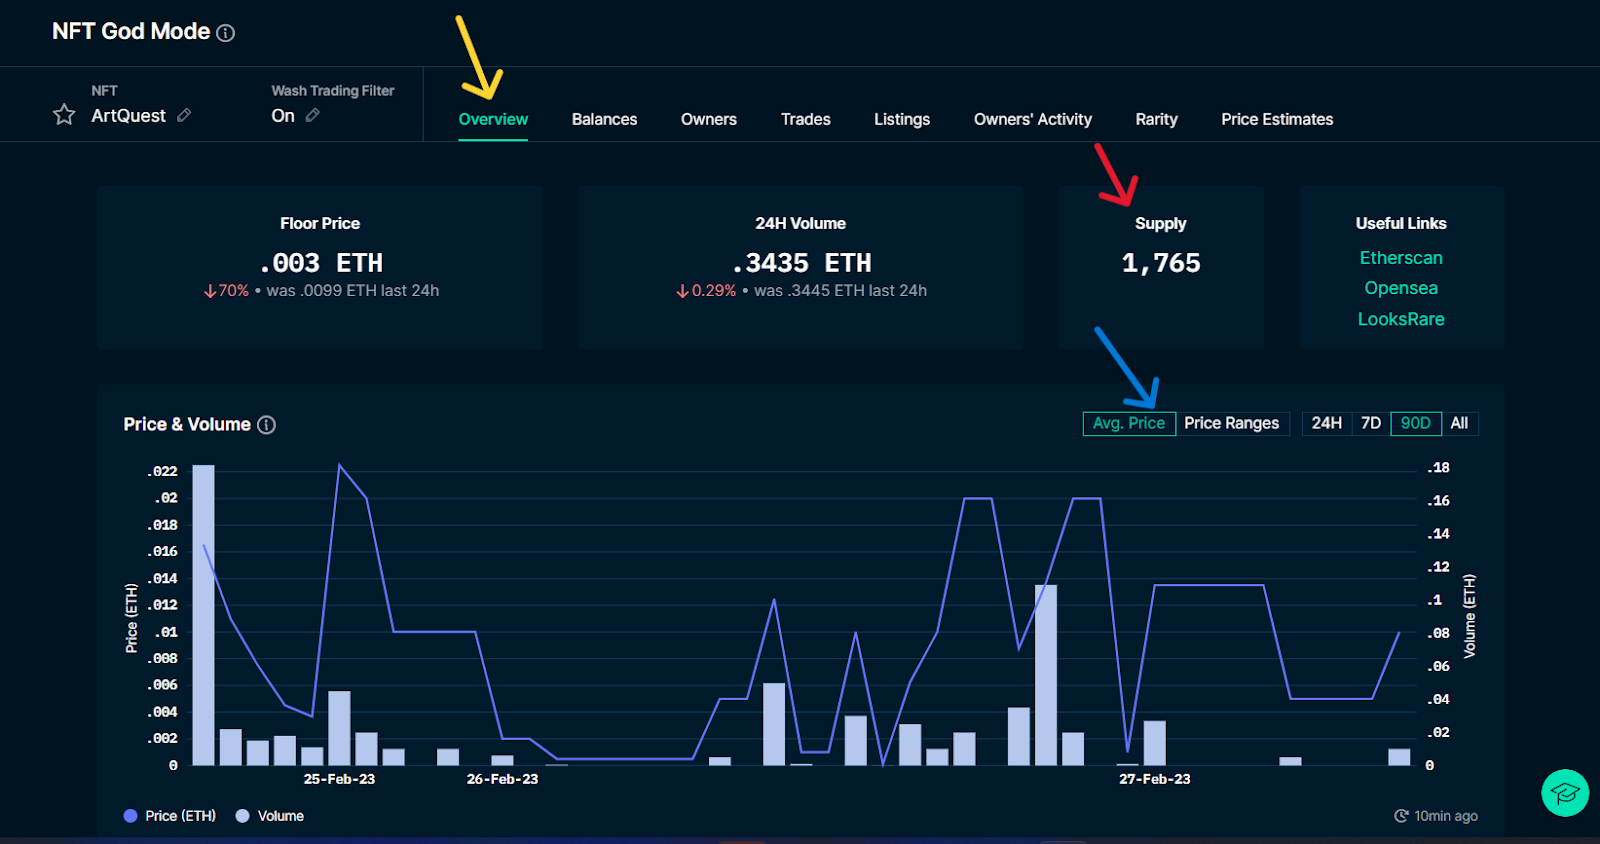
Artquest: NFT God Mode dashboard; Overview
In the NFT God Mode dashboard, we could switch from overview to Balances to owners etc., to understand better what project we are trying to get into.
The overview shows that Artquest has a Supply of about 1,765, about 1,105 addresses own at least one Arquest.
Comparing the both figures, this is almost diluted, which is a good thing, but the supply is kind of small.
Volume traded in 24hrs sits at 0.34ETH.
We could switch from Avg. Price to the price range, which can be useful when comparing price and volume.
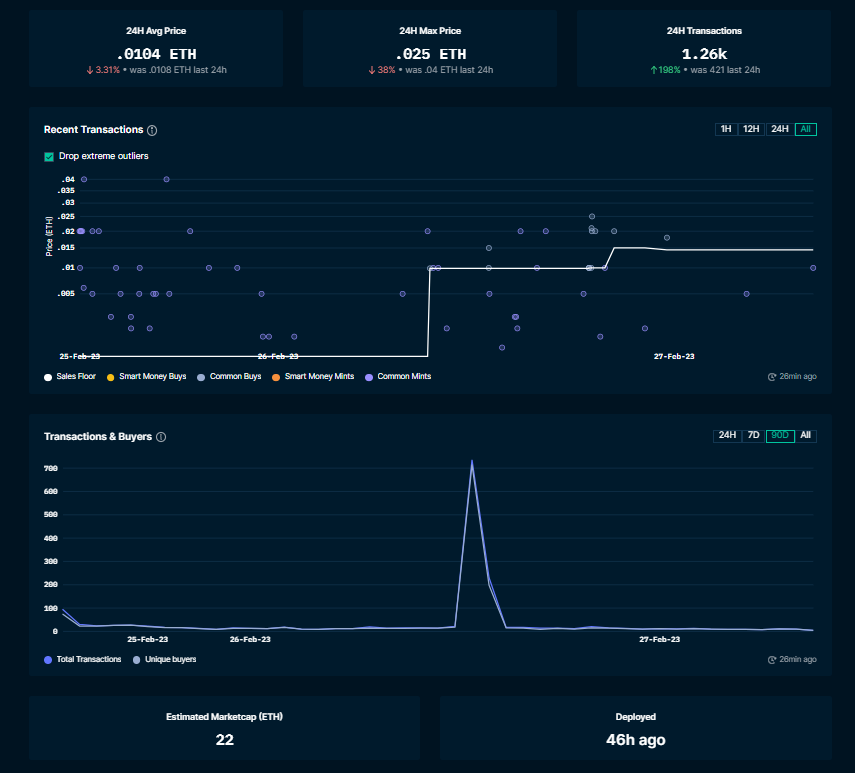
Artquest: NFT God Mode dashboard; Recent Transaction, Transaction & Buyers, Estimated Market Cap, and Deployed
In the Recent Transaction chart, we can check out how many Smart Money buyers and Smart Money Minters are, these are labels we should always watch out for.
It is obvious that the ArtQuest project is filled with common minters.
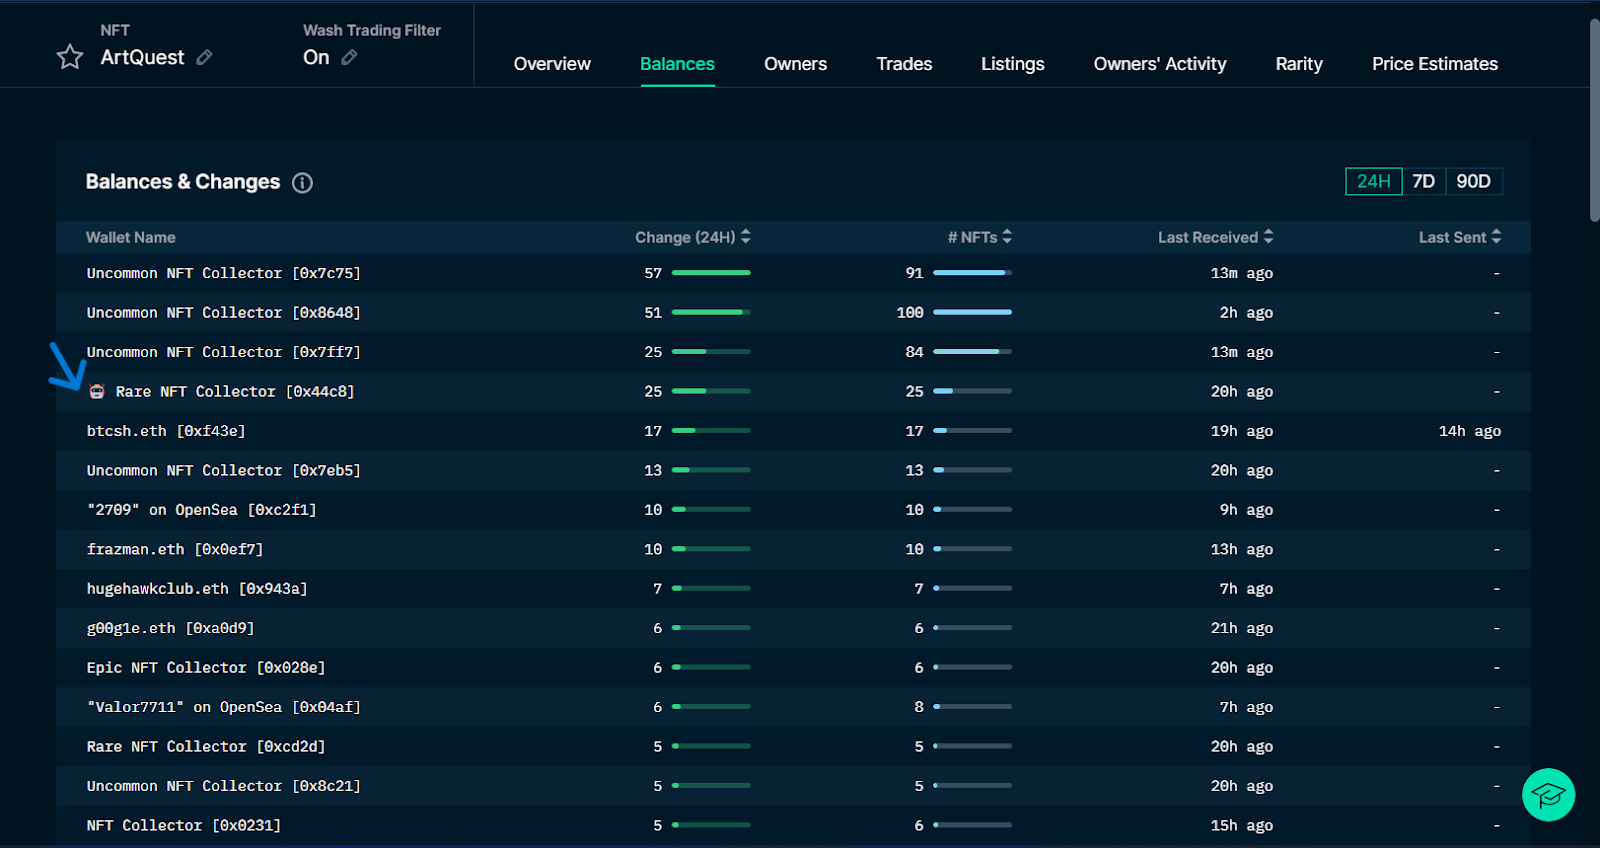
Artquest: NFT God Mode dashboard; Balances
NFT God Mode dashboard; Balances: Investors can see the bags of hodlers (holders) and see if they are bagging more or offloading their assets and when last they made their move.
This can be useful when trying to know how likely the floor can drop but remember, it is obvious that the project is almost diluted across with many addresses holding just one.
We also can spot a labelled address. Rare NFT collector who is also a DEX treader( the robot emoji signifies that)
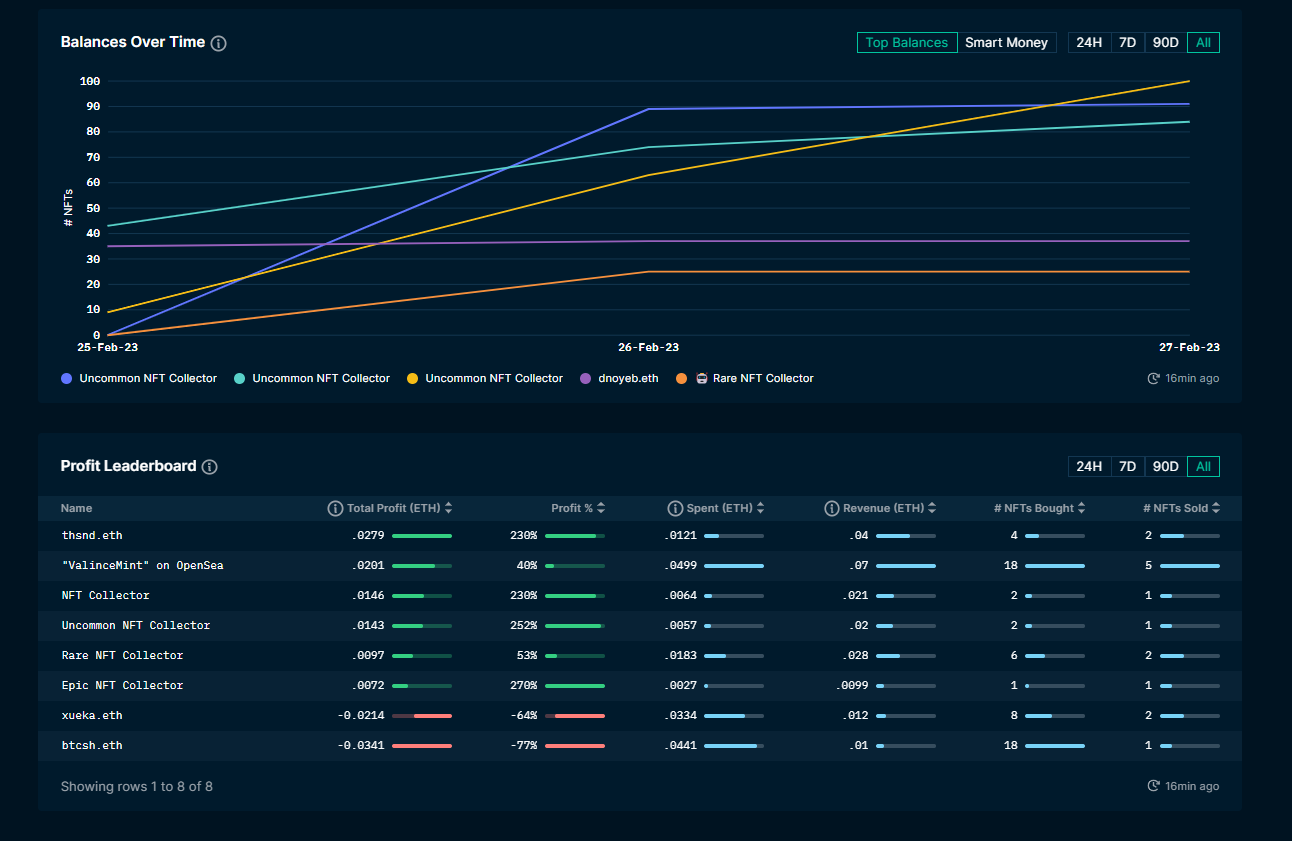
Artquest: NFT God Mode dashboard; Balances; Balances Over Time and Profit Leaderboard.
Profit Leaderboard
This shows investor profit made by other investors, the number of NFTs bought or sold, how much they invested into asset, and the revenue gotten after sales.
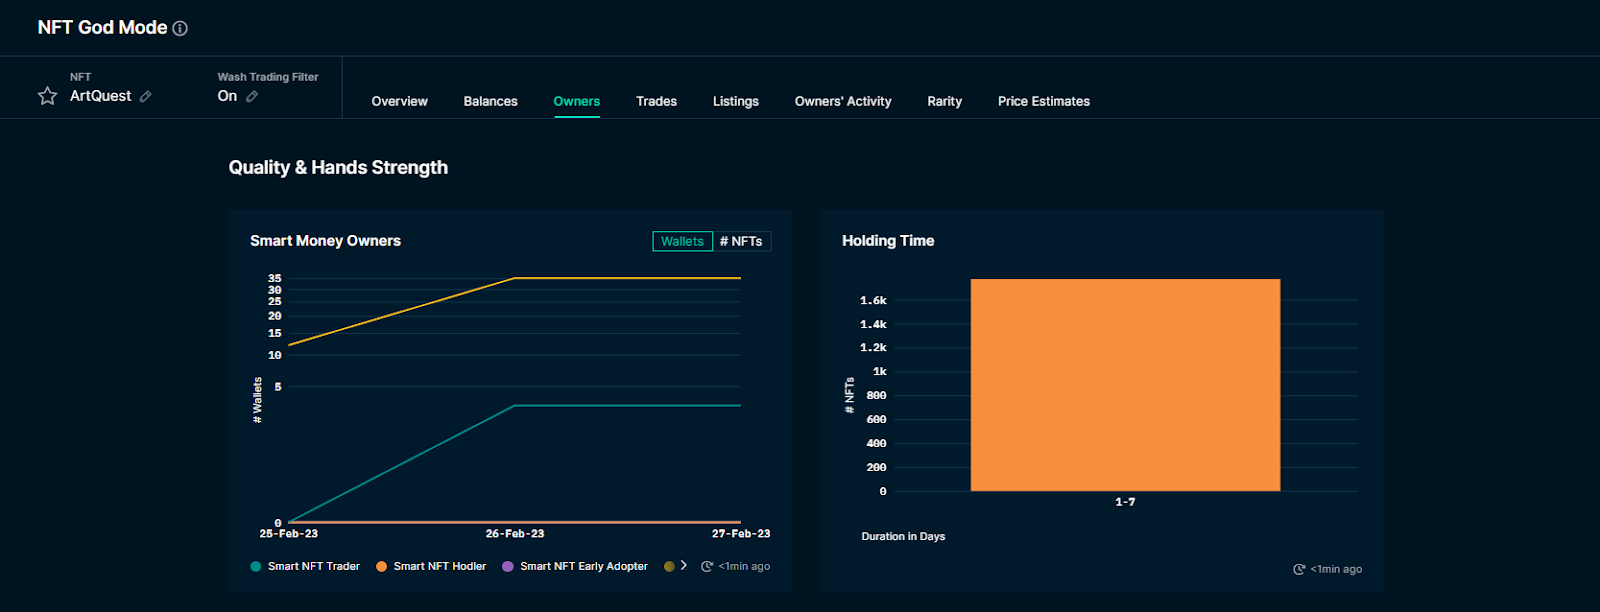
Artquest: NFT God Mode dashboard; Owners; Smart Money owners and Holding Time.
Smart Money owners and Holding Time is a chart fundamental to investors because it tells investors how much Smart Money wallets and Smart NFT Traders are buying in and how long other investors are willing to hodl.
This chart is not so clear how it works here since Artquest is 48 hrs. old, but comparing it with a chart from the Doodle NFT project, which is 499 days old(1 year +) at the time I analyzed this.
Artquest: NFT God Mode dashboard; Owners; Owned by Diamond Hands and Top Diamond Hands.
Owned by Diamond Hands and Top Diamond Hands – This displays how much people are willing to hold and what wallet has held the NFT the most.
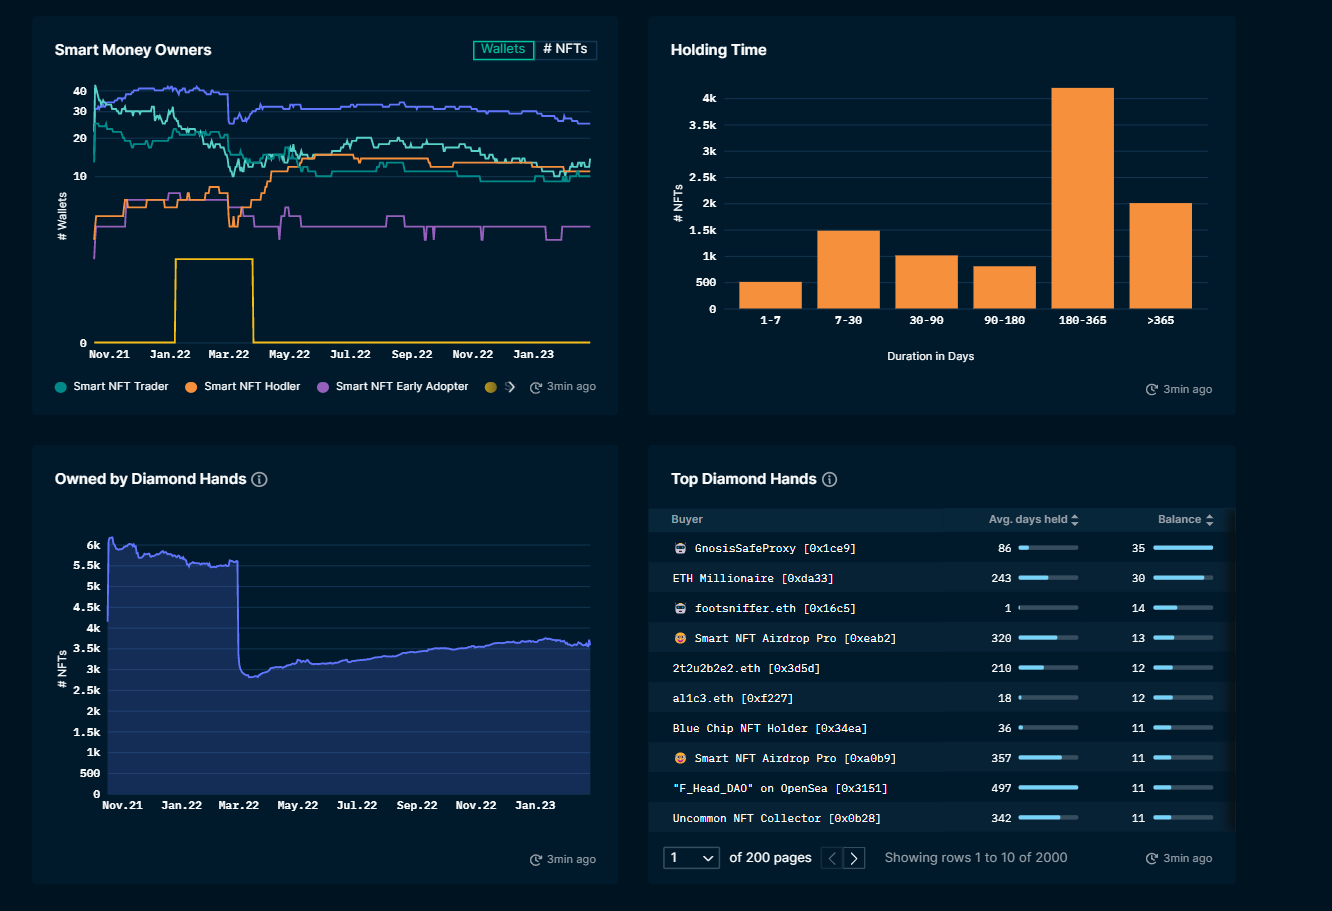
Doodle NFT: NFT God Mode dashboard; Owners; Smart Money owners, Holding Time, Holding Time Owned by Diamond Hands and Top Diamond Hands
3. Decision Making
At this point, you should have understood the NFT project and known what best moves to take if you should invest right away or something that you would want to watch closely, add to your watchlist, create a smart alert or even analyse further.
In own opinion, I am not a big fan of small supply projects because they can be manipulated easily when it comes to knowing how decentralised or diluted the project truly is.
Checking their engagement on their social media (Twitter) posts or joining their community like discord or telegram can help clarify this, and it’s also important to check if the labelled wallets did actually buy in or whether it was just a transfer.
Big players receive lots of airdrops from people trying to trick investors into thinking it’s a buy signal.
If you are a rare NFT hunter or a big fan of rarity, the Nansen tool can also help you spot your desired rare NTFs. It also displays how rare the NFT is in percentage and how much it was last sold.
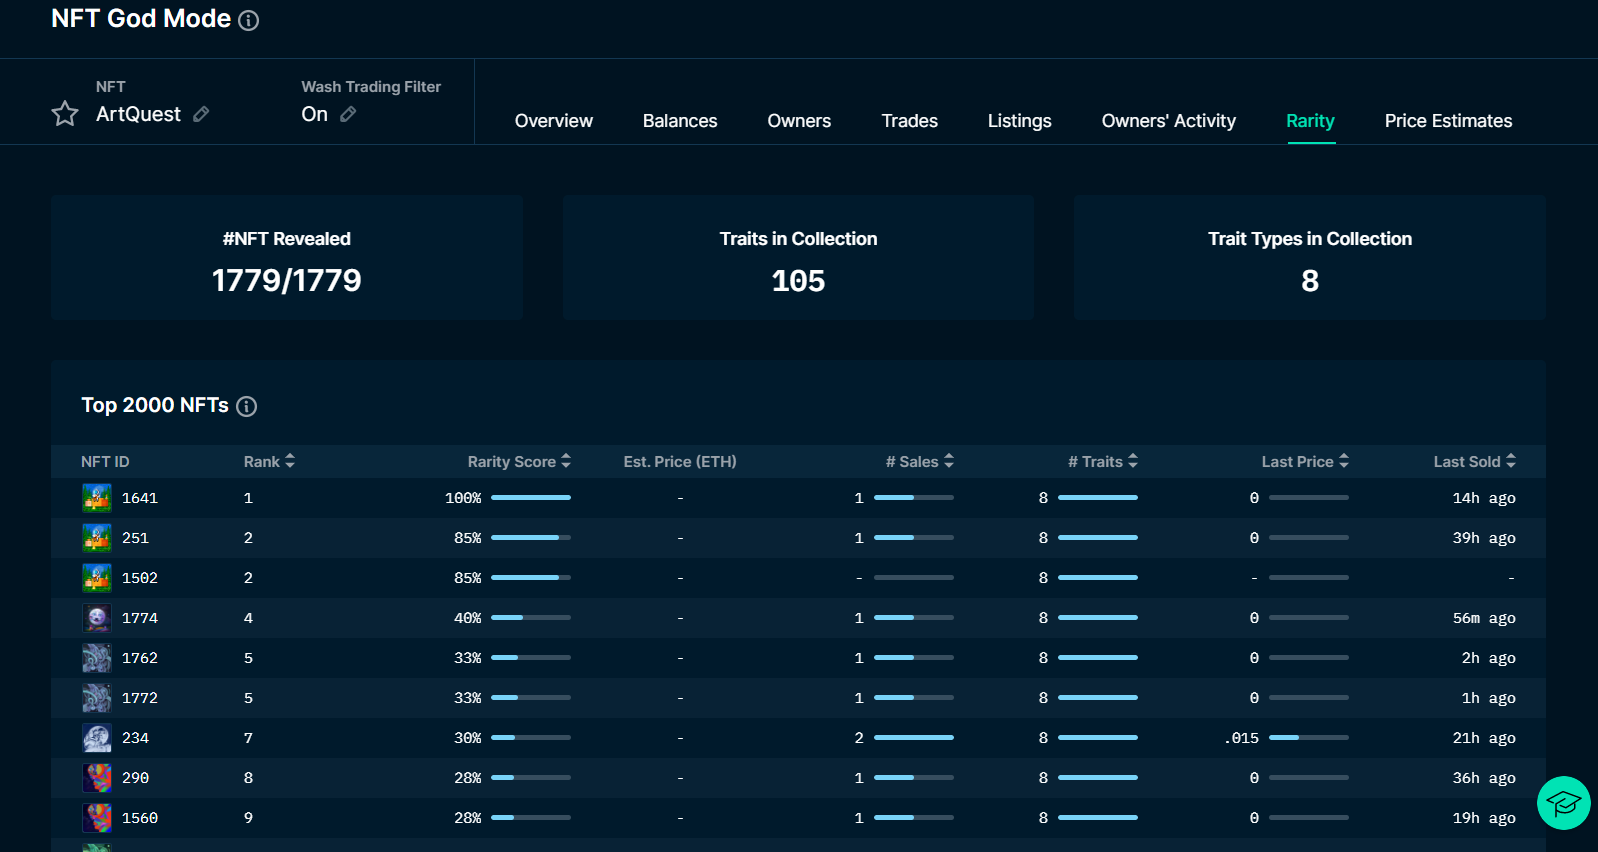
Artquest: NFT God Mode dashboard; Rarity
CONCLUSION
Nansen.ai is one of those blockchain analytical tools you should get used to using as a crypto investor, not necessarily shilling it to you.
But I am a big fan of tools that make Defi research easier and where the founders create flexible ways to analyze web3 assets.
If you have been in this game for a long time, you should know that a good product sells itself.
You can visit Nansen on YouTube for more beginner guides on how to use Nansen and follow Nansen on twitter for updates.
PS: None of the analysed projects is financial advice; please do your own research (DYOR).