


Before the next wave of growth, most coins might need a correction. Here’s the market’s analysis based
BTC/USD
Bitcoin’s (BTC) price has increased by more than 10% over the past week, despite the fact that it has decreased by 0.32% since yesterday.
Bitcoin (BTC) is trading in a constrained range on the local chart between the support level of $22,702 and the resistance level of $22,969. The rate is currently moving toward the upper line, which indicates that bulls won’t give up.
The rise might carry on to the $23,100–$23,200 range in case of a breakout.
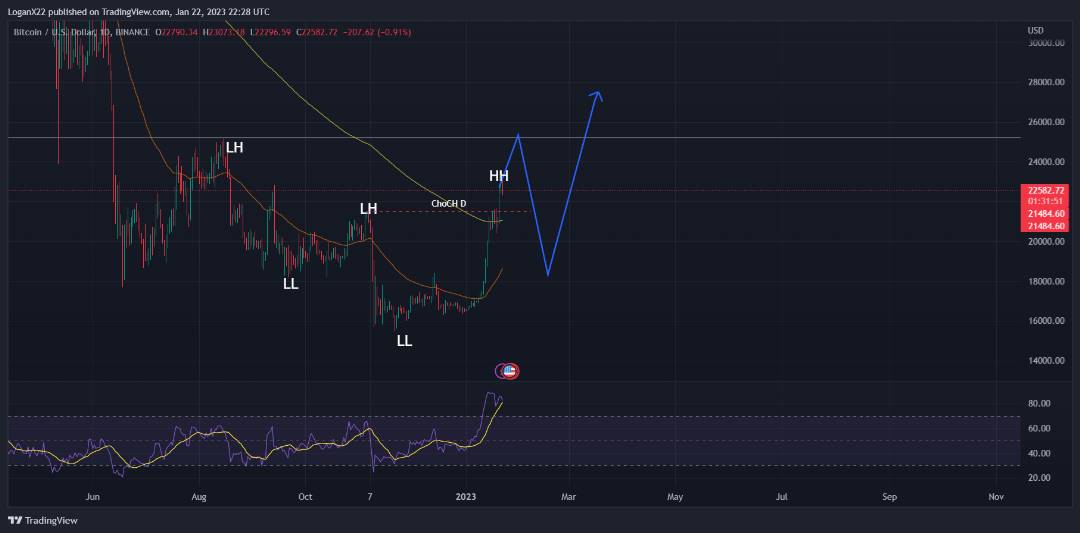
On the daily timeframe, there was a CHoCH (change of character or change in trend), where BTC went higher than the previous high (Lower High), generating a higher high (HH). This indicates a bullish trend.
Additionally, the price of BTC is higher above the 200 MA (Moving average) on the daily TF, which typically indicates that a price will continue on its current course for a while.
Expect BTC to retrace, secure liquidity, address market gaps, and produce a potential HL (Higher Low) before heading higher.
[…] If you missed last week’s market update, catch up here! […]