


_______________________________
BTC/USD:
BTC saw a 2023 ATH in April and has since been consolidating between $31,000 and $26,500 in price areas.
From a higher time frame, we remain in an uptrend.
A bullish pennant can be seen in the daily time frame. Price is heading towards $34,000, but this can only happen after a confirmation breakout on the top of the pennant, as illustrated in the chart analysis image below.
The price is bullish.
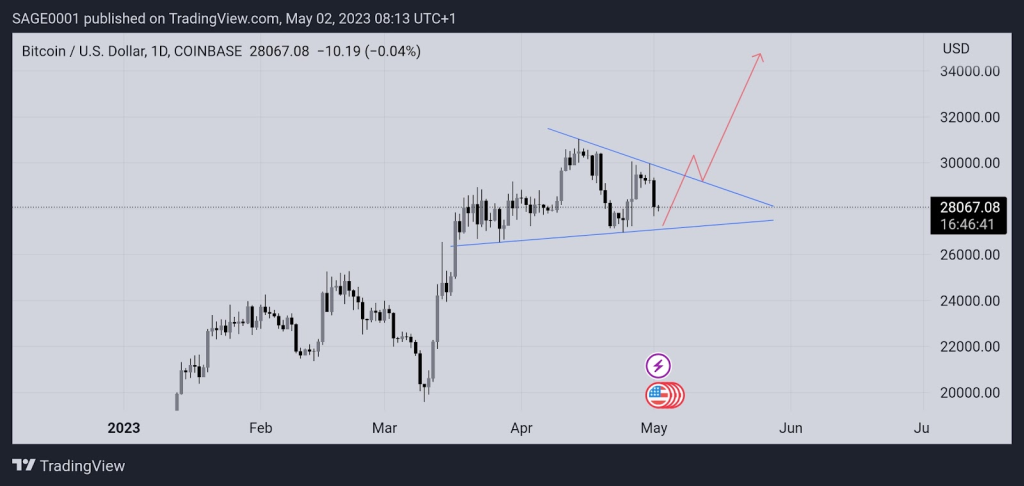
Chart showing performance of BTC/USD [Coinbase Chart] (Daily Time Frame). Source: Trading View
_______________________________
ETH/USD:
In the last two months, ETH has seen a continuous bullish break of a structure, taking it to $2,140 (the highest price level reached so far this year), upon which a retracement occurred immediately, taking the price to the nearest 4-hour demand zone and the price has been since consolidating there ($1800 – $1955), as seen on the 4-hour time frame.
A bullish move towards the 4-hour supply zone ($2100) is possible but, ultimately, depends on how the price reacts from the demand zone. Traders should be taking bullish positions now.
The price is bullish.

Chart showing performance of ETH/USD [Coinbase Chart](4hr Time Frame). Source: Trading View
_______________________________
Learn and stay accustomed to these basic trading abbreviations and terminologies here
_______________________________
⚠️This article does not contain investment advice or recommendations. Every investment and trading move involves risk, and readers should conduct their research when deciding.